Savings, pensions and European innovation

 By Yoram Wijngaarde and Dealroom Next-Gen API
Europe has a lot of long-term savings. Very little of it funds European innovation. That is bad for investment returns, for European growth, and for Europe's ownership of important technology. It is also fixable: a 0.5% pension allocation — about $75 billion — would be a serious start on the $30B-a-year scale-up gap, and the fund-of-funds machinery to deploy it already exists.
Europe has the money
1.1Europeans save a lot
Europeans save at a higher rate than Americans, and European households put away almost as much money each year in total. The difference comes after the saving: European households end up with far lower pension assets, and far less of their money reaches long-term investment such as venture capital.
Europe and the US, side by side
Four measures, each row scaled to the larger side. Europe includes the UK; population in the header.
Sources: population (header) — Eurostat and UK ONS, 2024 (EU27 449M + UK 69M); US Census Bureau, July 2024. Household saving — European Commission annual macro-economic database (AMECO, ESA 2010 national accounts), gross household + NPISH saving in US dollars, 2024: EU27 $1,737B + UK $247B = $1,984B; US $2,603B; the saving rate is the 2024 gross rate, combined EU27+UK saving over combined disposable income; the often-quoted “Europeans save four times more” compares Europe’s gross rate with America’s net one. The purchasing-power extension converts Europe’s saving at the same IMF purchasing-power parities as the household-wealth chart in section 3.2 — a ×1.38 uplift on market dollars. Venture fundraising — Dealroom.co funds database (fund type: venture capital; fund location), average capital raised per year over 2022–2025: United States ≈$100B, Europe including the UK ≈$30B (the ten-year 2016–2025 averages are $78B and $22B); by year since 2016, US: $28.0B, $24.7B, $63.4B, $49.0B, $77.0B, $130.7B, $176.3B, $70.9B, $73.1B, $82.9B; Europe ex-UK: $8.4B, $6.5B, $9.7B, $9.8B, $11.1B, $16.0B, $27.9B, $20.4B, $20.1B, $16.7B; UK: $2.2B, $4.3B, $5.0B, $5.0B, $8.6B, $13.0B, $12.3B, $8.2B, $7.2B, $3.9B. Rebuild the saving series with node scripts/build-saving-rates.mjs. Enterprise value — Dealroom.co, August 2026: combined enterprise value of VC-backed companies founded since 1990 and still operating, by headquarters — the same measure as the EMEA page's Combined EV. On the wider all-tech lens (dropping the VC-backed condition) the figures are $4.9T and $40.7T; the ratio barely moves.
1.2Europe has large pension funds
Europe has about $9.7 trillion of pension assets (OECD, end-2024). Counting household life-insurance savings — most of the long-term pool in France, Germany and Italy — the total reaches about $15 trillion (New Financial). Insurance money is funded and invested, but Solvency II keeps it in more conservative portfolios than pension capital.
Europe's long-term savings extend well beyond pension funds
$ pension and life-insurance assets, end-2024
| Country | % funded | Funded DB | Funded DC | Personal pensions | Tax wrappers (ISAs, PEA) | Life insurance & annuities | PAYG (PV of promises) |
|---|
The same pools country by country, with the pay-as-you-go promises that never became assets alongside them. Switch the unit to compare small and large economies.
Summary view — pensions — OECD Pension Markets in Focus, preliminary end-2024, total assets in asset-backed pension arrangements: UK $2,936B, Netherlands $1,771B, Switzerland $1,504B, Denmark $846B, Sweden $671B, France $390B, Germany $284B, Italy $267B, Belgium $193B, Finland $191B, Spain $177B; “Other Europe” is the remaining OECD-Europe jurisdictions, for a pension total of ~$9.7T. Insurance — Eurostat financial balance sheets (nasa_10_f_bs), instrument F62: household life-insurance and annuity entitlements, end-2024 stocks, converted at the 2024 average of US$1.0824 per euro — France $2,012B (assurance-vie lives here and is counted once), Germany $1,370B, Italy $843B, Denmark $402B, Spain $188B; EU + EFTA F62 totals $5.7T. The ~$15T long-term pool quoted elsewhere on this page is New Financial's estimate on its own scope; the $15.4T here is the sum of these bars, with UK insurance missing from the Eurostat series. Norway's GPFG oil fund is sovereign wealth and in neither measure. Rebuild: node scripts/build-retirement-insurance-data.mjs then node scripts/bake-retirement-savings-chart.mjs. Detail view — pension and wrapper columns for the UK, France, Germany, Denmark, the Netherlands and Sweden — Dealroom country pension-system research (2025), from the report “From Savings to Sovereignty”; France's wrapper cell is the PEA, €114B outstanding at end-2024 (Banque de France). Italy pensions: COVIP, December 2024. Spain pensions: Inverco and the Basque Government's EPSV report, end-2024. Life insurance & annuities: Eurostat financial balance sheets (nasa_10_f_bs), instrument F62 — household life-insurance and annuity entitlements, end-2024 stocks, converted at the 2024 average of US$1.0824 per euro; French assurance-vie is counted in this column and nowhere else. The Eurostat series does not cover the UK, so the UK insurance cell is n/a and its funded share excludes it. PAYG columns are present values of accrued future benefits — promises, not assets: the report's estimates for the six original countries; for Italy and Spain, Eurostat's accrued-to-date entitlements of unfunded schemes (nasa_10_pens1, 2021 closing stock: Italy 429%, Spain 496% of GDP) applied to 2024 GDP — on that same basis Germany is 320%, France 397%, the Netherlands 210%, Sweden 192% and Denmark 24%. % funded = the row's funded columns ÷ (funded columns + PAYG), computed from the values shown; public funded statutory pots (Denmark's ATP ~$0.12T, Sweden's AP buffer funds + PPM ~$0.45T, the Dutch AOW reserve) sit outside the table, so the Danish, Swedish and Dutch shares read low. The % of GDP and per-capita views divide the same dollar figures by 2024 GDP and population (Eurostat; UK: World Bank). Cross-check: OECD Pension Markets in Focus 2025 puts pension assets at 206% of GDP in Denmark, 151% in the Netherlands, 116% in Sweden.
Very little reaches venture
2.1Close to zero for venture
Invest Europe records around $15.5 billion of commitments from European pension funds and insurers to European venture funds over 2016–2025 — $6.3 billion from pension funds, $9.3 billion from insurance companies. Against the ~$15 trillion pension and insurance pool, that is roughly 0.10%.
The 0.10% problem: pension and insurance money barely touches venture
$ European household assets
Source: Dealroom, “From Savings to Sovereignty” (Sept 2025), based on New Financial, Eurostat, Atomico and Invest Europe data. Updates: household assets from Eurostat nasa_10_f_bs (EU27 €39.7T end-2024, provisional); European pension assets ~$9.7T end-2024 and ~$11.1T end-2025 (OECD Pension Markets in Focus; the $15T figure includes insurance-based pension savings per New Financial's wider definition); the venture figure is Invest Europe / European Data Cooperative commitments to European venture funds over the ten complete years 2016–2025: $6.3B from European pension funds plus $9.3B from insurance companies, $15.5B combined — the pension series is the one charted in A1, which runs from 2015 and so totals $6.5B. Allocation rates cross-checked against Atomico State of European Tech 2025. Matching the US allocation rate would unlock an estimated $210B of additional European venture funding over a decade (Atomico). Flow widths use a blended Europe + UK pension and insurance mix, heavily rounded — ~25% equities, ~50% fixed income, ~10% alternatives, ~15% cash, mixed funds and other — covering roughly €16T (EIOPA occupational-pension and insurance statistics, 2024; ONS UK funded occupational pension schemes statistics, Q3 2025; Bank of England / PRA insurance aggregate data). Insurers hold more fixed income than pension funds (roughly 15% equities, 45% fixed income and credit, 40% funds, cash and other), which pulls the blend toward bonds. The blend approximates the ~$15T pool drawn here rather than measures it. Venture capital sits inside alternatives in those sources rather than beside it, and its arrow is drawn at a minimum visible width: at 0.10% it would still be under a quarter of a pixel at this scale. The top-300 allocation charted in A7 weights equities more heavily — that lens covers the largest funds worldwide.
2.2Startups yes, scale-ups no
Europe has enough capital for many early-stage rounds; the large gap appears when companies need more money to scale — about $30 billion a year against the US, concentrated in $100M+ rounds.
A $30B-a-year gap, filled from abroad
$ VC invested per year — Europe, and the US at the same round sizes
Source: Dealroom.co, “From Savings to Sovereignty” analysis — European and US VC investment per year, averaged since 2015, by round size; the source-of-capital split is the average since 2020. Pro-forma segments show the extra annual pace if pensions moved the selected share of the $15T pool into venture, deployed over about ten years.
2.3Foreign investors fill the gap
Much of Europe's later-stage funding comes from outside Europe: at scale-up stage, 58% of the capital comes from abroad, 41% from the US alone. Foreign capital helps European companies grow. It also means that more of the ownership, the returns and the influence over those companies sit abroad.
Foreign investors supply 58% of European scale-up capital
Source of VC invested in European companies, average since 2020 — by investor origin and round stage.
Source: Dealroom.co, “From Savings to Sovereignty” — share of VC investment into European companies by investor origin, averaged over 2020–2025, by round size: early $0–15M, breakout $15–100M, scale-up $100M+. Shares are the report’s rounded figures, so columns can sum to just over 100. The aggregated European-vs-overseas version of the same split shades the funding-gap chart in section 2.2.
The consequences
3.1Fewer companies make it big
The outcome gap compounds stage by stage. American startups graduate to breakout funding at twice Europe's rate, and the gap widens with every step: at $100 billion and above the US has 29 companies against Europe's four — Revolut, Booking.com, ARM and Spotify — and seven worth $1 trillion or more against none.
Europe already has 4 centicorns. Gigacorns are in sight
Companies founded since 1990 reaching each stage — the count, and the share of all that raised $100K+. Bars compare the two regions within each stage.
Source: Dealroom.co next-gen API, August 2026 — companies founded since 1990 and still operating, excluding corporates tagged mature or outside tech, by headquarters (Europe includes the UK and Switzerland). Funding stages count companies that ever raised at least $100K, $15M and $100M in total; valuation stages use the latest Dealroom valuation (market capitalisation for listed companies) at $1B+, $10B+, $100B+ and $1T+. Shares are of each region's own $100K+ population: United States 79,432 companies, Europe 54,771. Europe's centicorns are Revolut, Booking.com, ARM and Spotify — Spotify counted at its public market capitalisation (≈$105B, August 2026), which runs ahead of the platform's valuation mark. Bars are scaled within each stage: the larger count fills the cell, the other is drawn in proportion.
3.2Founders and companies move
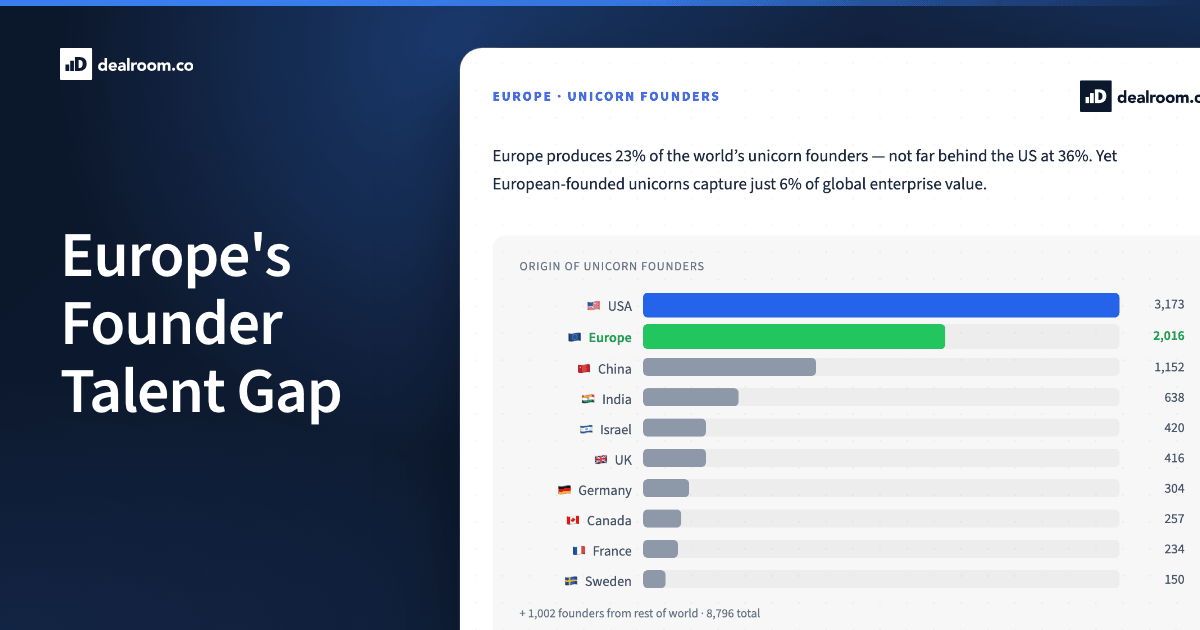
Europe produces founders at close to the American rate — 23% of the world's unicorn founders, against 36% for the US. But 42% of European-founded unicorns were built in the US (407 of 964), and individual founder flows run fourteen to one toward America: 630 European-origin founders built there, 44 Americans built here. Capital is not the only reason; companies and talent move toward deep capital markets. The full data is in the Europe talent gap analysis and the founder-flows map.
42% of European-founded unicorns were built in the US
Left: where the world's 8,796 unicorn founders come from. Right: where the unicorns those founders created were built — hover a bar to switch origin.
Hover or tap an origin bar to switch the streams.
Source: Dealroom.co Europe talent gap analysis and Founder DNA origins research, August 2026 — founder origins of the ~8,796 founders behind the world’s 3,295 unicorns (USA 3,173, Europe 2,016, China 1,152, India 638, Israel 420). Europe includes the UK. Destination splits are computed from the origin-researched unicorn cohort (verified current headquarters; a company counts once per origin group): European-origin 964 unicorns → United States 407 (42%: 315 founded there, 92 relocated), United Kingdom 152, Germany 68, France 46, Sweden 44, Switzerland 31, other countries 216; US-origin 1,456 → 1,378 in the US (95%: 1,335 + 43 relocated); Chinese-origin 565 → China 433 (77%), US 85 (15%: 77 + 8); Indian-origin 323 → US 198 (61%: 177 + 21), India 101 (31%); Israeli-origin 181 → US 126 (70%: 54 founded there, 72 relocated — the one origin where relocation outweighs founding there), Israel 43 (24%). The started/moved split compares each company’s verified founding country with its current headquarters.
By founding era the pull has strengthened, not eased: 21% of the pre-2010 vintage of European-founded unicorns started in the US; among those founded since 2017 it is 49%. The newest generation increasingly starts there rather than moving later.
European founders increasingly start their unicorns in the US
Unicorns created by European-origin founders, by founding era — split by where the company started, or where it is based today.
Source: Dealroom.co Founder DNA origins research, August 2026 — unicorns created by European-origin founders (a company counts once; verified founding and current-headquarters countries), by company launch year. Founded before 2010, 392 companies: founded in the US 83 (21%), in Europe 279 (71%), elsewhere 30 (8%); based in the US today 122 (31%), Europe 249 (64%), elsewhere 21 (5%). Founded 2010–2016, 378: founded — US 145 (38%), Europe 191 (51%), elsewhere 42 (11%); today — US 189 (50%), Europe 163 (43%), elsewhere 26 (7%). Founded 2017–2025, 179: founded — US 88 (49%), Europe 71 (40%), elsewhere 20 (11%); today — US 93 (52%), Europe 67 (37%), elsewhere 19 (11%).
3.3Lower returns for savers
Technology is creating a large share of new economic value, and ownership decides who collects it. Since 2000, valuation gains on household financial assets have averaged 5.2% a year in the US against 1.3% in the euro area — equivalent to 24% of gross disposable income against 4.2% (ECB, Philip Lane, Oct 2025). If European pension funds do not own the companies creating the value, European savers miss that growth.
US household assets gain 5.2% a year; euro-area assets 1.3%
Average annual valuation gains on household financial assets since 2000 — as a share of the assets themselves, and as a share of gross disposable income.
Source: European Central Bank — Philip Lane, “The Asset Holdings of Euro Area Households” (Dublin, October 2025): average annual valuation gains on household financial assets since 2000 — as a share of the previous year’s asset stock, United States 5.2%, euro area 1.3%; as a share of gross disposable income, 24% and 4.2%. Latest observations Q2 2025. The gap reflects both what households own (equity-heavy vs deposit-heavy portfolios) and how those assets performed.
3.4Dependent on foreign technology
AI, defence, energy and information infrastructure are becoming more important to economic security. Europe does not need to own everything; it needs to own enough to remain a serious participant, and ownership follows the capital that funded the companies early.
Market share of critical technologies
% market share held by the leaders — Dealroom estimates
Source: Dealroom indicative estimates based on desktop research, compiled 2024 — shares are directional, not audited market data. The foundational-AI row uses late-2023 data and predates xAI and DeepSeek. The orbital-launch row is 2025: SpaceX lifted 2,213 tonnes to orbit — over 80% of all mass the world launched, on about half of all launches (SpaceX S-1, May 2026, via BryceTech). The grey remainder of each bar is everyone else, including local players.
The case for pension funds
4.1Strong returns
European venture has produced competitive long-term returns. But the average hides unusually large differences between managers: in venture, selecting the right portfolio matters far more than in most asset classes. The risks are real: venture is illiquid and access to the best funds is hard. Those are reasons to invest carefully, not reasons to invest nothing.
Public-market investors can buy an index and automatically own the outliers. Venture has no equivalent: a broadly diversified but average selection of funds can still miss the small number of companies that creates most returns.
Returns
European venture returns lead North America over 10 and 15 years
Net return after fees, % a year
Source: Invest Europe / Cambridge Associates, “The Performance of European Private Equity” benchmark (2024) — European venture 10-year net IRR 20.77% vs North America's 18.18%; 15-year 16.57% vs 16.09%. Net of fees, expenses and carried interest, pooled across 223 European venture funds raised 1986–2023, to end-2023. The public-market comparison is from the same partnership's PME research (mPME basis): the 2019-vintage report put European growth capital at 13.28% vs MSCI Europe 7.32%, and buy-outs against MSCI Europe 5.84%, over long horizons — no VC-vs-MSCI pair is published for the 2024 vintage, so the listed-equity figure is stated in the caption as a range rather than drawn as a bar. Scottish Mortgage, SpaceX pre-IPO briefing note (Q2 2026): $200M invested in 2018, fair value £2.98B at 31 March 2026 (≈19.7×, 19.3% of the portfolio).
4.2A long time horizon
Pension funds invest over decades, and innovation takes decades to compound. That makes pension capital a natural funder of venture and growth companies. The honest objection is access, not returns: most pension funds cannot build a venture team or reach the best managers alone. Fund-of-funds and shared vehicles exist to solve exactly that, and they anchor most of the programmes in section 7.
4.3Pensions need a strong economy
A pension system depends on two things: investment returns, and contributions from workers and employers. A stronger economy supports both — an externality no single chief investment officer is paid to price. In the US the loop runs forwards: pension capital → venture → technology companies → returns and payroll → $39.0T of funded pots. In Europe it runs in reverse ($5.0T, OECD 2023). The pension system funds the economy that funds it.
4.4America has done it before
It took one regulatory change to start. Through 1978 the prudent-man rule made a venture commitment look imprudent on its own; in 1979 the US Department of Labor clarified that under ERISA — the 1974 federal law that sets the rules private pension plans must follow — risk is assessed at portfolio level — and pension money began to flow. In 1978, $424 million went into new US venture funds, with pension funds supplying 15% of it; by 1986 the total passed $4 billion and pension funds supplied more than half. Total fundraising grew more than 9× in eight years; the pension contribution grew more than 31×.
How a rule change unlocked billions in pensions
The US Department of Labor clarified that the “prudent-man rule” assesses risk across the whole portfolio. As a result, a venture commitment is no longer imprudent on its own.
This was not the only cause of Silicon Valley's rise: capital-gains changes, R&D spending and fund performance also mattered. But research finds that easing pension-investment restrictions had a significant positive effect on venture fundraising — and a separate study using the 1979 shift found that venture capital significantly increased patenting.
Sources: Gompers & Lerner, “What Drives Venture Capital Fundraising?” (NBER WP 6906) — $424M committed to new US venture funds in 1978, pension funds 15% of contributions; over $4B in 1986, pension funds more than 50%; the paper finds easing pension restrictions had a significant positive effect on fundraising. The fundraising figures are nominal, and the 1986 pension amount is a lower bound because the paper states both the total and the pension share as “over”. Innovation impact: Kortum & Lerner, “Does Venture Capital Spur Innovation?” (NBER WP 6846) — using the 1979 policy shift as an instrument, venture capital was under 3% of corporate R&D but accounted for an estimated 15% of industrial innovation. The regulatory step is the US Department of Labor's 1979 clarification of ERISA's prudent-man rule, assessing risk at portfolio level.
Grow the pool
The size of the pool is itself a policy choice. The Netherlands, Sweden and Denmark pre-fund retirement through invested schemes; France, Germany and Italy mainly promise future pensions from future taxes, and a promise never becomes an asset.
5.1The US pool is 2.9 times larger
The US retirement system holds $44.1 trillion against Europe's $15.0 trillion including insurance-based savings — about 2.9 times as much, on a similar population. On pension assets alone the gap is wider: $42.9 trillion against $9.7 trillion, or 4.4 times. The pool is not fixed: enrol more people into funded schemes and it grows.
US retirement assets are 2.9 times Europe's
Retirement savings including insurance-based savings and annuities, end-2024, broken down by plan type. Both bars share one dollar scale.
Europe's split across plan types is a Dealroom estimate on OECD and Eurostat data; the insurance segment has no UK data (no Eurostat series). On pension assets alone the gap is 4.4 times ($42.9T against $9.7T).
Source: Europe — OECD Pension Markets in Focus, preliminary end-2024 (≈$9.7T of pension assets, the country build-up in section 1.2) plus ≈$5.3T of insurance-based long-term savings and annuities; the plan-type split is a Dealroom estimate on OECD and Eurostat (nasa_10_f_bs F62) data. United States — ICI, The US Retirement Market, fourth quarter 2024: $44.1T across IRAs, defined-contribution plans, government and private defined-benefit plans and annuities.
The same gap shows at household level: US households hold 2.9 times the EU27 average in financial assets per person. The distribution behind the average is very unequal — the note under the chart has the median.
Where household wealth sits
Financial assets per person by instrument — purchasing-power dollars by default, or unadjusted market exchange rates.
Source: Dealroom.co analysis — Eurostat financial balance sheets (nasa_10_f_bs, households + NPISH, non-consolidated, 2025) per person (demo_pjan), converted at IMF WEO purchasing-power parities (PPPEX); United States from Federal Reserve Z.1 table B.101 (end-2025) — the same household + nonprofit scope. Approach follows Bruegel's per-capita comparison (Christie, McCaffrey & Pinkus, “EU savers need a single-market place to invest”, Apr 2024). The “$ market” view converts at the year-average exchange rate instead (US$1.13 per €, 2025) — the unadjusted gap is wider (~4×) because most EU price levels sit below the US. Money-market funds count as investment funds, not deposits; “Other” bundles debt securities, loans and other receivables. Deposit share of total household financial assets: EU27 ~30% (barely moved since 2010), US ~10%. The cost of the allocation gap: since 2000, annual valuation gains on household assets averaged 24% of gross disposable income in the US versus 4.2% in the euro area (ECB, Philip Lane, Oct 2025); OECD private pension assets are $39.0T in the US vs $5.0T in the EU (2023). Median comparison: UBS Global Wealth Report 2025 — total net worth per adult (financial + real assets − debt, a wider measure than this chart): US average above $620,000 (world #2) against a median of $124,041 (about #28); Luxembourg’s median is $395,340 and Belgium’s is also above the US. Survey pairs tell it the other way per household — US SCF 2022 median net worth $192,900 vs euro-area HFCS 2021 median €123,500 — so the safe claim is concentration, not that the typical American holds less. Rebuild: scripts/build-household-wealth-per-capita.mjs.
Automatic enrolment is the proven way to enlarge them: in the UK, the share of eligible private-sector employees saving into a workplace pension went from about 40% before the 2012 reform to 89% in 2024 (DWP). Ireland was the last OECD country without such a scheme until My Future Fund began enrolling on 1 January 2026, covering roughly 760,000 workers who had no workplace pension. The EU recommended in November 2025 that every member state adopt auto-enrolment with an opt-out. Each euro enrolled this way is new funded capital — a bigger pool to allocate from, whatever the allocation rate.
5.2Most of Europe is unfunded
Most European countries mainly promise future pensions from future taxes, and a promise never becomes an asset. A minority — Denmark, the Netherlands, Sweden, Switzerland, the UK — banked the money instead, and only banked money can be invested. The country-by-country split is the Detail view of the long-term savings chart in section 1.2.
Funded savings vs unfunded pension promises
Financial assets per person vs unfunded pension promises
Source: Dealroom.co analysis of Eurostat. Horizontal: accrued-to-date entitlements of unfunded government and social-security pension schemes (nasa_10_pens1, closing stock, % of GDP, 2021 — the latest triennial vintage; the 2024 edition lands end-2026). Vertical: household holdings of listed shares, investment funds, insurance and pension entitlements (nasa_10_f_bs, 2024) per household (lfst_hhnhtych) or per person (demo_pjan) — toggle the denominator. The “Pensions only” view plots just the insurance & pension component (F6) of the same balance sheet; bubble size is population (or number of households, matching the denominator). Per-household figures run ~2–2.5× the per-capita ones (household size); on a per-capita basis these values line up with Bruegel's published per-capita comparisons. The original version of this chart was built on Bruegel's 2021 Capital Markets Union work; Bruegel's 2025 update (Kirkegaard) reaches the same conclusion — unreformed pensions are the real obstacle to EU capital-market depth. Denmark's unfunded figure is low because its tax-financed folkepension sits outside social insurance. USA & Japan (estimates, not Eurostat-comparable): US vertical = Fed Z.1 household equities + funds + life insurance + pension entitlements (2024) per Census household (~$655K ≈ €606K; Z.1 equities include closely-held businesses); US horizontal = Social Security's unfunded obligation for past and current participants ($52.9T, 2025 Trustees) ÷ GDP ≈ 181% — federal-employee and state & local plans would add more. Japan vertical = BoJ flow-of-funds equity + investment trusts + insurance & pensions (Mar 2026) per household (~¥20.6M ≈ €121K); horizontal = public-pension implicit debt (¥1,110T ≈ 200% of GDP, 2019 MHLW actuarial valuation via Oguro/CIGS). Their pensions-only values are the insurance + pension lines of the same sources: US ≈ €95K per person, Japan ≈ €26K. United Kingdom (estimate, same caveat): vertical = ONS national balance sheet, households' insurance & pension entitlements £3.1T end-2024 (≈ €53K per person; the household-assets view adds £1.1T of equity & investment funds, which includes unlisted equity and so runs a little wide of the Eurostat listed + funds measure), converted at €1.18 per £; horizontal = ONS Table 29, 2018 vintage — state pension entitlements 224% of GDP plus unfunded public-sector employee schemes 55%, ≈280% combined; the 2021 edition publishes no state-pension line, so the UK's horizontal is three years older than the rest.
Why so little reaches venture
Parts 1–5 leave a question open: the money is there and the returns case holds, yet pension allocations to venture sit close to zero. Six blockers explain most of the gap — cost, scale, capacity, access, governance and fragmentation.
Different funds hit different blockers. A large fund struggles with ticket sizes and access; a small fund with cost and workload; a commercial provider with the annual fee comparison; a first-time venture investor with capability and the access cold start.
Six blockers keep pension money out of venture
- Fees over returns — index funds are cheap, liquid and easy to defend; venture is none of those.
- Short horizon — boards are judged yearly; a failed fund draws scrutiny, a missed one rarely does.
- Low portfolio impact — a small allocation is a lot of work without moving total returns.
- Ticket-size mismatch — a €50–100M ticket would dominate most European funds.
- Too many relationships — broad exposure needs 10–20 funds, each with its own approvals.
- Aggregation adds fees — fund-of-funds bundle pension-size exposure at a cost.
- No venture knowledge — power-law returns and manager selection are specialist work.
- Weak information — incomplete data, paper valuations, short track records.
- Heavy workload — diligence, capital calls and reporting make small allocations expensive.
- No cheap shortcut — teams cost money, specialists add fees, direct needs more skill.
- Oversubscribed managers — strong funds favour their existing investors.
- Power-law returns — a few funds drive most of the return.
- Cold start — committees want proof of access; access takes years to build.
- Direct is not easier — it moves the selection problem to companies.
- Regulatory burden — approvals and compliance sized for bigger tickets, differing by country.
- Measurement mismatch — annual benchmarks against ten-year funds and the J-curve.
- Headline risk — losses, fees and sensitive holdings attract criticism.
- Solvency II — capital rules make illiquid assets expensive for insurers.
- Different systems — some countries hold large funded pools, others almost none.
- Home vs foreign bias — local mandates limit diversification, foreign ones export capital.
- Too few scaled bridges — few platforms combine size, access and acceptable fees.
- Waiting for each other — pensions wait for vehicles, funds for anchors, platforms for demand.
Source: Dealroom.co. What should change in response — start small, improve access, build on existing programmes — is part 7. How the blockers land on Europe's three kinds of pension scheme is charted in A9.
What should change
Europe does not have to persuade thousands of institutions. Among the world's 300 largest pension funds, the top 20 hold $9.5 trillion between them — 42.1% of the total — and 152 of the 300 are sovereign or public-sector funds holding 70.6% of the assets. A few dozen decisions would move more capital than a change of mood across the rest of the market.
The same concentration sets the constraint. The institutions with the most capital are mostly public, so they publish their holdings, answer to a minister or a supervisory board, and carry political risk on every allocation. Governance — blocker 5 — weighs heaviest on exactly the funds that could commit the most. That is why the rest of this part is about lowering the cost of a first commitment rather than raising the target.
Twenty funds hold 42.1% of the assets of the world's 300 largest
Share of the assets of the 300 largest pension funds, by fund size and by owner, end-2023
Source: Thinking Ahead Institute / Pensions & Investments 300 ranking, 2024 edition; figures to end-2023, when the 300 funds held $22.6 trillion in total. The world map in A8 plots $22.4 trillion of that, because five funds in the ranking publish no assets figure. “Sovereign and public sector” is the source's own classification and covers national reserve funds, public-employee schemes and social-security funds; the 148 remaining funds are corporate and private schemes.
7.1Start small
Europe does not need to move from zero to a large allocation overnight. A target of 0.5% of the wider $15 trillion savings pool equals about $75 billion — invested gradually across several years and many funds: over a ten-year fund life, roughly $7 billion a year. The what-if pills on the funding-gap chart in section 2 include exactly this example — tap 0.5% to see it against the $30B-a-year scale-up gap.
7.2Improve access
Pension funds need diversified exposure to strong venture and growth managers, and few can build that capability in-house. Fund-of-funds and other shared vehicles provide the exposure without requiring every pension fund to build its own venture team — which is the pattern nearly every programme below uses.
Which route fits depends on the size of the fund. Smaller funds delegate: assets run by an outsourced chief investment officer reached $4.1 trillion at the end of 2023, growing 14% a year since 2019. The largest asset owners are going the other way — 42% insourced more over the last five years, and 54% expect to insource more over the next five — so what they need is access and co-investment rights rather than another layer of fees.
Source: Thinking Ahead Institute Global Asset Owner Peer Study 2024 and Charles Skorina & Company, both cited in the Thinking Ahead Institute / Pensions & Investments 300 report (2024 edition). The insourcing figures are given as reported; the study does not state whether they count respondents or assets.
7.3Build on existing programmes
Denmark, Finland and France have used public institutions to bring pension investors into private markets for years; Germany, the UK and the EU are now building the same machinery. One pattern repeats: the state anchors a fund-of-funds or sets a target, institutions co-commit, and top-tier access becomes something a pension can buy rather than build.
Almost all of it is aimed at pension funds, and insurance is the larger pool in France, Germany and Italy. Insurers are held back by capital rules rather than by access: under Solvency II an insurer must hold 49% capital against unlisted equity, against 22% for holdings that qualify as long-term equity investments — a category the 2027 revision widens to cover more private equity and infrastructure. Until that bites, insurance money moves through the same fund-of-funds structures, or not at all.
The initiatives racing to unlock pension capital
Scale, mechanism and status of each programme — updated August 2026.
| Initiative | Launch | Scale / commitment | Status & the last 12 months |
|---|---|---|---|
| 🇩🇰Dansk VækstkapitalPension-backed fund-of-funds into Danish VC and growth | 2011 | ~DKK 9.4B DVK I–III, 55 funds | On trackManagement moved from state-owned EIFO to Danske Bank at the start of 2025; DVK IV launched under Danske Bank with a DKK 1.7B first close (Nov 2025), EIFO and Danish pension funds among the investors. |
| 🇫🇮Tesi / KRR seriesState fund-of-funds with pension LPs (Keva, VER, Ilmarinen) | 2008– | KRR I–IV, €135M→€175M per vintage | On trackState venture investing consolidated under Tesi in 2025; Finnvera’s VC arm folded in. |
| 🇳🇴GPFG unlisted-equity mandateWhether the ~$2T oil fund may hold unlisted companies — Norges Bank says yes | 2023– | ~$2T fund listed-only today | DebatedNorges Bank recommended opening the fund to unlisted equities (Nov 2023); white papers have kept the mandate closed and the question now sits with the fund's new Expert Council. In Aug 2026 the fund disclosed a stake in pre-IPO SpaceX — unlisted holdings are allowed when a listing is intended. |
| 🇫🇷Tibi InitiativeInstitutions pledge to accredited VC and growth funds | 2019 | €6.4B + €7B + €13B phases 1–3; ~€31B cumulative | Phase 3€13B phase 3 under way and now open to pan-European funds; increasingly the model other countries copy. |
| 🇩🇪WIN-InitiativeKfW-anchored pact (Allianz, BlackRock, Deutsche Bank…) into German VC | 2024 | ~€12B committed to 2030 coalition target >€25B | Deploying€2.6B deployed by end-2025; KfW is preparing the successor Wachstumsfonds for 2026, and 24 firms formed the GVGF coalition (Jun 2026) to court insurers and pensions. |
| 🇬🇧Mansion House AccordVoluntary DC pledge, now backed by a capped statutory reserve power | 2023 / 2025 | 17 DC providers, ~90% of savers 10% private markets, ≥5% UK by 2030 | Stalling~£1.6B in by Oct 2025 — roughly 0.6% against the 5% pledge — and engagement is contentious. Railpen, Nest and the LGPS pools are exploring a £1B UK Scale-up Fund with the British Business Bank. |
| 🇳🇱Pension reform (Wtp)System-wide DB→DC transition frees riskier long-term allocations | 2023 | ~€550B moved on 1 Jan 2026 ~9.5M members switched to DC | TransitionLargest tranche converted on schedule; full migration deadline 2028. |
| 🇩🇪Bavaria foundations ruleLets public and private foundations access VC via fund-of-funds | 2025 | 5% allocation allowed | In forceFirst Land-level rule of its kind; pension associations now back a wider allocation push. |
| 🇪🇺ETCI → ETCI 2.0EIB/EIF fund-of-funds courting pension funds and insurers (TechEU) | 2023 / 2026 | €3.9B raised; 2.0 targets €15–20B to unlock ~€80B for scale-ups | 2.0 launched€1.25B EIB/EIF anchor committed Dec 2025. |
| 🇪🇺EU pensions packageAuto-enrolment with opt-out, dashboards, IORP II & PEPP reform | 2025 | EU-wide recommendation | RecommendationAdopted 20 Nov 2025; national uptake pending. |
| 🇪🇺IORP II review — 2% venture floorMinimum venture allocation written into the IORP II review | 2026 | ≥2% of assets to VC schemes >€1B AUM — ~280 schemes | ProposedRapporteur’s amendment in the Parliament’s review; mandate vote due after summer 2026. Invest Europe backs it; pension-industry pushback is strong. |
| 🇺🇸401(k) access to alternativesExecutive Order 14330; DOL fiduciary safe-harbor for PE/VC in defaults | 2025 | $12T+ DC market opened | RulemakingDOL proposal Mar 2026; final rule expected late 2026. |
Sources: Danske Bank press releases (management of DVK I–III transferred from EIFO to Danske Bank at the turn of 2024/25; DVK IV launch May 2025 and first close 4 Nov 2025); Tesi and the Finnish Ministry of Economic Affairs (state VC consolidation, May 2025); DG Trésor and École polytechnique (Tibi phases); KfW and IPE (WIN); GVGF founding announcement (Jun 2026); HM Treasury, ABI and LCP (Mansion House Compact 2023, Accord of 13 May 2025, Pension Schemes Act 2026 — Royal Assent 29 Apr 2026, mandation reserve power capped at 10%/5% and usable only 2028–32); British Business Bank and IPE (£1B UK Scale-up Fund exploration, Jul 2026); DNB and European Pensions (Wtp “invaren”); Sifted (Bavaria); EIF/EIB press (ETCI 2.0, 26 Mar 2026); European Commission Recommendation (EU) 2025/2384; IPE (IORP II rapporteur’s ≥2% venture amendment and the industry response); White House EO 14330 (7 Aug 2025) and DOL EBSA proposed rule (31 Mar 2026). Norway: Norges Bank advice on unlisted investments (Nov 2023), Ministry of Finance Government Pension Fund white papers 2024–2026 (Meld. St. 7 (2025–2026), 27 Mar 2026) and NBIM half-year report 2026 — the GPFG is sovereign wealth rather than a pension plan, but it is Europe's largest single pool of long-term public capital. Status labels are Dealroom’s read of progress, August 2026. This table updates the 2025 slide from the “From Savings to Sovereignty” report.
7.4Measure it
Europe should report how much pension capital is committed, how much is invested, and where it goes — targets and pledges kept separate from money at work. Dealroom already ranks the pension funds and other limited partners behind European venture in the LP ranking; the ten below are the European pension funds whose venture managers have the strongest outcome record.
The pension funds behind European venture
Top 10 European pension funds by the combined power-law score of the venture managers they back.
| # | Pension fund | AUM | % VC | VC AUM | VCs backed | Power-law score |
|---|---|---|---|---|---|---|
| Loading the ranking… | ||||||
The score sums the power-law score of every venture manager the fund backs, within the selected slice — filters re-rank rather than hide. Explore all 9,132 LPs in the full ranking.
Source: Dealroom LP ranking — LP-to-fund commitments and holdings from disclosures and filings; a manager's power-law score aggregates its outcome record (unicorns, exits, fund performance signals). European pension funds only, 257 ranked; assets and venture allocations are estimates. Same scoring module as the full ranking.
Pension capital is not enough
More pension capital is one of three things that have to move. The other two: an environment that produces companies worth backing, and a capital market big enough for pension funds to operate in.
8.1A business-friendly environment
Capital only works if Europe produces enough companies worth backing. That depends on the environment around founders: how easy it is to start a company, pay staff in stock options, and restructure quickly when a company fails. Josh Lerner calls this work “setting the table” (Boulevard of Broken Dreams) — his study of public venture programmes found that the ones that worked fixed the environment for entrepreneurs before, or alongside, the money. Denmark and Finland did it in that order: business-friendly reform first, with the pension fund-of-funds in section 7.3 built on top.
Chart from the Dealroom analysis Employment adaptability × unicorns; the full methodology is on that page.
8.2One capital market, not 27
Pension funds allocate in large tickets. Europe's market is cut into 27 sets of supervision, insolvency law and fund rules, so investment vehicles stay national and small — too small for a large pension fund to use.
The friction is not only in finance. Mario Draghi argued in the Financial Times (February 2025) that Europe has in effect put tariffs on itself, citing IMF estimates that internal barriers equal a 45% tariff in manufacturing and 110% in services. Lorenzo Bini Smaghi showed (IEP@Bocconi, July 2025) that those numbers overstate the barriers: the method counts home preferences — Italians buying Italian wine — as if they were tariffs. The underlying fact stands either way: trade between EU countries runs at less than half the level of trade between US states.
The Letta report (April 2024) and the Draghi report (September 2024) reach the same conclusion. The Savings and Investments Union is the Commission's programme to act on it: harmonised supervision, insolvency and fund rules, so vehicles can reach the scale pension funds need.
The three reinforce each other, and they do not need to happen at the same time. More pension capital gives companies a reason to scale in Europe, stronger companies give pension funds more to buy, and a single market lets both operate at size. Together they have a far higher chance of success than any one alone.
Three priorities that depend on each other
Source: Dealroom.co — the three levers of this analysis: pension capital (parts 4–7), the business environment and a single capital market (part 8). They do not need to happen at the same time; each accelerates the other two.
Conclusion
The savings exist; the connection is missing
Europe already has the savings, and it already produces strong founders and companies. What is missing is the connection between the two. A small, gradual, well-diversified pension allocation is a practical start — not to support venture capital for patriotic reasons, but to give European savers more exposure to future growth and Europe more ownership of its economic future. The pension system funds the economy that funds it.
Background data
A1Where European venture funds raise their money
Invest Europe records who commits the capital European venture funds raise. Over 2015–2025, governments and sovereign wealth funds committed $37.4 billion — more than any other identified investor type. European pension funds committed $6.5 billion, less than corporates, family offices, funds of funds, banks or insurers. Drag the slider to change the window.
Governments committed $37.4B over 2015–2025; European pension funds $6.5B
$ committed to European venture funds
2025 is reported but about a quarter of its commitments are not yet attributed to an investor type, so recent windows will still shift as Invest Europe classifies them.
Source: Invest Europe / European Data Cooperative — incremental amounts raised by European venture funds, by type of committing investor, converted to US dollars by Invest Europe; Dealroom analysis, August 2026.
The ECB counted the same thing for both sides of the Atlantic. Pension funds made 36% of the commitments to US venture funds over 2015–2025 and 10% of the commitments to EU funds; insurers made 7% in both. The EU's largest backer is government: 36% of commitments, against 4% in the US.
Pension funds are 36% of US venture-fund backers, 10% in the EU
Number of LP commitments made (not $ capital allocated)
Source: ECB — “Exploring the investor landscape for venture capital”, Financial Integration and Structure in the Euro Area, 2026 (Chart A). Shares are the number of commitments made by limited partners located in each region to VC funds, 2015–2025; weighting by estimated commitment size keeps the composition broadly unchanged, though the EU pension share rises to 19% and the US foundation share from 25% to 35%. LPs corresponding to public-backed vehicles are counted as government entities — in the EU over half of the original funds-of-funds commitments were reclassified this way, reflecting the scale of the European Investment Fund.
A2How the mix has shifted
Governments and sovereign wealth funds are the only investor type that grew almost every year: from $1.2 billion in 2015 to $5.6 billion in 2025 — about 40% of the money with a reported investor type so far for that year. The newest flagship fund follows the same pattern: in May 2026 the EU selected EQT to run the €5 billion Scaleup Europe Fund, with the European Commission's €1 billion the largest founding commitment, alongside Denmark's EIFO at €200 million. Its first investment, in August 2026, co-led a €1 billion round in satellite maker ICEYE.
Government commitments rose from $1.2B to $5.6B a year; no other source kept pace
$ commitments to European venture funds
Source: Invest Europe / European Data Cooperative, converted to US dollars; Dealroom analysis. Commitments without a reported investor type (about $48B over the period) are excluded from the lines. The red line sums European pension funds and insurance companies.
A3Pension funds over time
In dollars, pension funds commit four to five times more than in 2015. Overall fundraising grew just as fast, so the share has not moved: European pension funds were 4.4% of the money with a reported investor type in 2015 and 3.9% in 2025, and never above 7% in between. Adding insurers — the other long-term savings pool — lifts the level to about 11% but not the trend: 9.9% in 2015, 8.7% in 2025.
Pension and insurance money is not a bigger share than a decade ago
$ commitments to European venture
There is no directly comparable US series here — Invest Europe covers European funds — but the direction of the gap is documented: Atomico's State of European Tech 2025 puts European pension allocations to venture at about a third of US levels, and section 4.4 shows what moved the US number — after the 1979 ERISA clarification, pension money went from 15% to more than half of US venture fundraising within a decade.
Source: Invest Europe / European Data Cooperative, converted to US dollars; Dealroom analysis. With insurance included, the bars add insurance-company commitments (Invest Europe does not break those down by home region, so they carry no region split) and the share line divides pension plus insurance money by the same denominator. The share line divides European pension funds by the money with a reported investor type — commitments with no reported type (Invest Europe's “unclassified”) are excluded from the denominator. US comparison: Atomico, State of European Tech 2025.
A4Pension commitments by home region
Pension involvement is concentrated. Nordic and North American funds supplied nearly half of all pension money in European venture over 2015–2025. It is also a habit that differs by country: pension funds are about a quarter of everything Nordic investors commit to European venture funds, and about 3% of what investors from France & Benelux, the German-speaking countries or the UK & Ireland commit.
Nordic and North American pension funds supplied nearly half the pension money
$ pension commitments to European venture funds
Red = North American funds, the one large overseas source; grey = European funds whose country is not reported.
Source: Invest Europe / European Data Cooperative, converted to US dollars; Dealroom analysis. Region is the home region of the committing pension fund as recorded by Invest Europe.
A5Every source at once
European VC funds raised $8.9B from pension funds over 2016–2025, more than half of it from Nordic and North American funds. The heatmap puts that row against every other source of LP money: governments committed four times as much, and France & Benelux investors alone supplied $52B of the $130B with a reported type and region.
Where the money for European venture funds comes from
$ committed to European venture funds by investor type and the investor’s home region, 2016–2025 summed.
Source: Invest Europe / European Data Cooperative, converted to US dollars; Dealroom analysis. Rows group Invest Europe’s LP types; columns are the committing investor’s home region. Money with no reported investor type (about $45B over the period) or no reported home region (about $9B) is excluded, which is why the pension row shows $8.6B of the $8.9B pension total.
A6Pension equity allocations by system
The same caution shows in pension equity allocations. US funds hold 44% of assets in their home equity market alone; no European system reaches 10% at home — the UK holds 4%, the Netherlands 0.5% — and most European systems hold under a third in equities overall.
Not just venture: European pensions shun equities too
% of pension assets held in equities
Most European systems hold under a third of their assets in equities; Norway’s 72% is the oil fund, all of it invested abroad. Hover a row for the domestic vs rest-of-world split.
Source: New Financial analysis — the allocation to domestic and international equities in pension systems around the world. Rows are sorted by total equity share; assets in $tn; percentages are shares of total pension assets (the remainder sits in bonds, real assets, cash and other instruments), and totals reflect source rounding. Excludes UK and Canadian personal pension assets because of lack of data. Norway includes only the global and national public reserve funds; the global fund (GPFG), by far the larger of the two, is mandated to invest exclusively outside Norway — high risk appetite, none of it at home.
A7The wider private-markets gap
The caution extends past equities. Among the world's 300 largest pension funds, the European ones hold 13.4% of their assets in alternatives and other instruments. North American funds hold 29.3%. Europe puts the difference into bonds instead: 38.8% against North America's 18.0%.
Alternatives here covers real estate, infrastructure, private equity, hedge funds, private credit and cash, and the source does not break venture out of it. So this is not a venture allocation and should not be read as one. What it measures is how much room these portfolios leave for private markets at all — and the venture shortfall in part 2 sits inside a portfolio that is roughly half as exposed to private markets as North America's to begin with.
European funds hold 13.4% in alternatives, North American funds 29.3%
Weighted average asset allocation of the world's 300 largest pension funds, split by where the fund is based, end-2023
Bonds are the mirror image of the gap. European funds hold 38.8% in bonds and North American funds 18.0%, so most of what Europe does not hold in private markets sits in fixed income rather than in equities.
Source: Thinking Ahead Institute / Pensions & Investments 300 ranking, 2024 edition; figures to end-2023. Weighted averages. Complete asset-allocation disclosure was available for 185 of the 300 funds, covering 75% of their assets, and shares are of assets held by funds based in each region rather than of each region's whole pension market. “Alternatives & other” is the source's own category and includes real estate, infrastructure, private equity, hedge funds, private credit and cash; venture capital is not reported separately, so no venture share can be read off this chart.
A8The world's pension funds
The 300 largest pension institutions in the world hold $22.4 trillion between them. US funds hold $8.4 trillion of that across 141 institutions — more than a third of the total, from one country. Norway's Government Pension Fund is Europe's largest single pool at $1.6 trillion, though it is sovereign wealth rather than a pension scheme; the Netherlands comes next, with $1.3 trillion across 12 funds.
A9Scheme types
Which of the blockers in part 6 bite depends on the kind of pension a fund runs, and Europe runs three kinds at once. Among the world's 300 largest pension funds, the European ones hold 45.8% of their assets in defined-benefit schemes, 36.9% in state reserve funds and 12.8% in defined-contribution plans.
- Defined benefit — the employer promises a set retirement income and carries the investment risk.
- Defined contribution — the saver gets whatever the pot earns and carries the investment risk, so providers are compared on annual fees.
- Reserve fund — money a national government sets aside for future pension payments, with no explicit liabilities against it.
- Hybrid — a scheme with both a defined-benefit and a defined-contribution part.
Each meets a different wall. Defined-benefit schemes are largely closed to new members and shortening their horizon as they mature. Defined-contribution providers need a daily price and a fee they can defend, which is blocker 1 in its sharpest form. Reserve funds can hold a ten-year asset comfortably, and they are government money, which is where the headline risk in blocker 5 lands hardest. North America has no reserve funds at all, so a policy written for its market does not transfer.
A third of Europe's largest pension assets sit in state reserve funds
Share of assets by scheme type among the world's 300 largest pension funds, split by where the fund is based, end-2023
Source: Thinking Ahead Institute / Pensions & Investments 300 ranking, 2024 edition; figures to end-2023. Scheme type was disclosed by 277 of the 300 funds, covering 94% of their assets, and the regional shares are of assets held by funds based in that region rather than of each region's whole pension market. Reserve funds are set aside by national governments to meet future pension payments; they carry no explicit liabilities and are neither defined benefit nor defined contribution.
M · How it's built
How this is built
- Saving rates (1.1) — European Commission AMECO, ESA 2010, via DBnomics; gross
ASGHand netASNHon the same definition for both regions.build-saving-rates.mjs - Pension & insurance pools (1.2) — OECD Pension Markets in Focus (end-2024); Eurostat
nasa_10_f_bsF62 for insurance; COVIP and Inverco for Italy and Spain. - The $50T→$15T→0.10% flow (2.1) — Dealroom, “From Savings to Sovereignty” (Sept 2025), except the venture figure: Invest Europe commitments from European pension funds ($6.3B) and insurance companies ($9.3B) to European venture funds, $15.5B over 2016–2025. Arrow widths from a blended Europe + UK pension and insurance mix over roughly €16T, heavily rounded (EIOPA 2024; ONS Q3 2025; Bank of England / PRA): ~25% equities, ~50% fixed income, ~10% alternatives, ~15% cash, mixed funds and other.
- Valuation gains on household assets (3.3) — ECB, Philip Lane, October 2025.
- Venture returns (4.1) — Invest Europe / Cambridge Associates 2024 benchmark, pooled net IRR.
- Household wealth per person (5.1) — Eurostat
nasa_10_f_bsperdemo_pjan, at IMF WEO purchasing-power parities; US from Fed Z.1 B.101. Follows Bruegel’s April 2024 comparison.build-household-wealth-per-capita.mjs - Funded vs promised (5.2) — Eurostat
nasa_10_pens1(unfunded S13PU, 2021 — triennial, 2024 vintage due end-2026),nasa_10_f_bsandlfst_hhnhtych.build-pension-scatter.mjs - Scheme mix, concentration, allocation (7, A7, A9) — Thinking Ahead Institute / Pensions & Investments 300, 2024 edition, pages 34–35, 10 and 39; typed in from the published tables. The three cuts cover different subsets of the 300, so each card carries its own disclosure base.
- Insourcing and outsourced CIOs (7.2) — Thinking Ahead Institute Global Asset Owner Peer Study 2024 and Charles Skorina & Company, both cited on page 8 of the same report.
- Initiatives tracker (7.3) — primary announcements: Commission communications, HM Treasury, KfW, DG Trésor, EIF/EIB, DOL. Hand-maintained, last reviewed July 2026.
- Appendix A1–A5 — Invest Europe / European Data Cooperative: amounts raised by European venture funds each year, by type and home region of the committing investor, 2015–2025, converted to dollars by Invest Europe. Dealroom snapshot, August 2026. “Reported investor type” is what Invest Europe calls classified; 2025’s total is complete but about a quarter has no type yet.
- EU vs US investor base (A1) — ECB, “Exploring the investor landscape for venture capital” (2026): each type’s share of the number of LP commitments, public-backed vehicles counted as government.
- Equity allocations by system (A6) — New Financial.
- World map (A8) — the same top-300 ranking, head-office cities added and geocoded by Dealroom, projected with
projectLonLat()(Kavrayskiy VII). Ranks 108–112 publish no assets figure and are not drawn.build-world-pension-funds.mjs
Full source text and caveats sit behind the ✱ on each card. The six-system fiscal scorecard, the Japan debt charts and the Savings and Investments Union timeline moved off this page in the 2026-08 restructure.
More Dealroom analysis on savings & pensions


Who actually funds European tech?
The Dealroom platform tracks the LPs, funds and rounds behind these numbers — including which pension funds are finally moving.